

The cryptocurrency market has been rocked by a massive sell-off, with the Bitcoin price plunging 26% from its July highs above $70,000. This dramatic decline comes amid a broader crash in global financial markets, reflecting growing economic uncertainty and investor risk aversion.
Crypto Winter Returns?
The crypto sphere was not spared from this turbulence, as risk aversion sentiments reverberated across the industry on Monday. Bitcoin witnessed a staggering 16% decline, reaching as low as $48,860 on Binance, while Ethereum, the second-largest cryptocurrency, experienced its most substantial fall since 2021, reaching $2,116.
Notably, the fallout extended to crypto-related stocks, with crypto companies such as Coinbase Global, MicroStrategy, miners Marathon Digital Holdings and Riot Platforms also seeing significant drops in their share values.
As concerns about the economic outlook intensified amid a global equity sell-off, concerns about the efficacy of heavy investment in artificial intelligence (AI) added to market unease. Geopolitical tensions in the Middle East further added an additional layer of uncertainty and contributed to investor anxiety.
Latest Bitcoin (BTC) Price Analysis and Predictions
Bitcoin Price Predicted To Hit $15,000
The past 24 hours witnessed a total liquidation of approximately $1.2 billion in crypto bets, marking one of the most significant liquidations since early March. Factors such as the unwinding yen carry trade and adjustments to higher interest rates in Japan played a role in this market upheaval.
Despite the current crash, some experts remain bearish on the crypto market’s long-term prospects. Justin Bennett, a crypto analyst, suggests that $15,000 Bitcoin and $700 Ethereum are “very much on the table.”
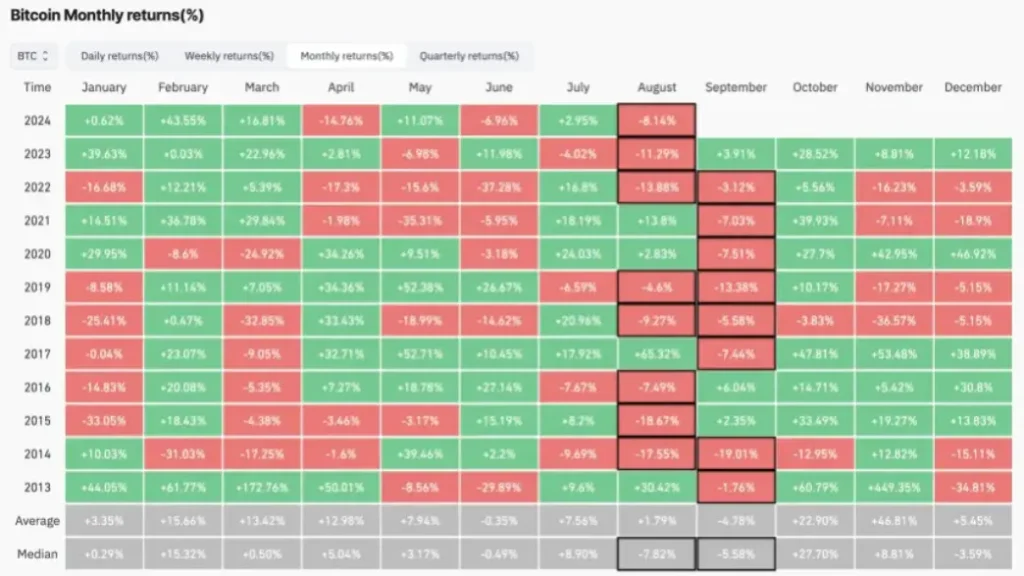
What’s more, the image above shows that historical data further paints a bleak picture of Bitcoin’s performance in August and September, historically the worst months with average losses of -7.82% and -5.58%, respectively.
Light At The End Of The Tunnel?
Despite these bearish factors, crypto analyst Ali Martinez points to the Bitcoin MVRV Ratio on the 30-day time frame, which has not been this low since November 2022, right after the FTX collapse. “That period marked a bottom and an excellent buying opportunity,” he said.
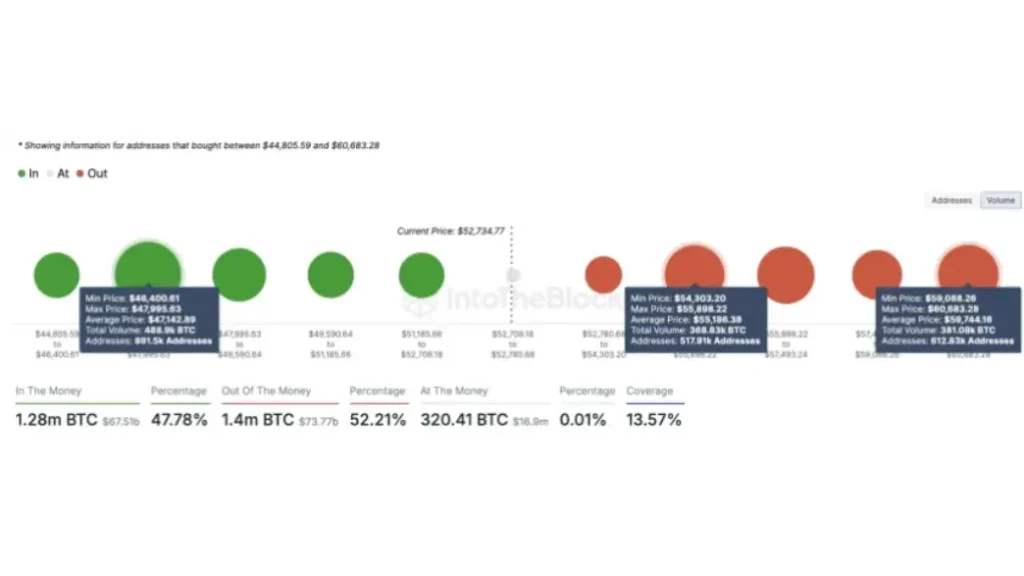
Martinez also shared a key support that the bulls must hold to avoid further declines, stating that at around $47,140, nearly 900,000 addresses previously bought 489,000 BTC. Although the Bitcoin price has not tested this level, it will be a crucial level to watch and hold for BTC’s price prospects.
Additionally, crypto analyst Rekt Capital points to a dramatic increase in sell-side volume, suggesting a potential near-term bottom and a possible bounce to higher levels, as has happened in the past.
Economist and analyst Timothy Peterson’s data shows that in previous instances when the Bitcoin price dropped 25% in 10 days, it has rebounded 62% of the time, with an average gain of 17%. In 20 days, Bitcoin has fully recovered 15% of the time.
Also key will be the performance of the spot Bitcoin exchange-traded fund (ETF) market, which has previously supported the Bitcoin price leading to the all-time highs reached in March.
At the time of writing, the largest cryptocurrency on the market has managed to mitigate losses and rebounded to $53,260.